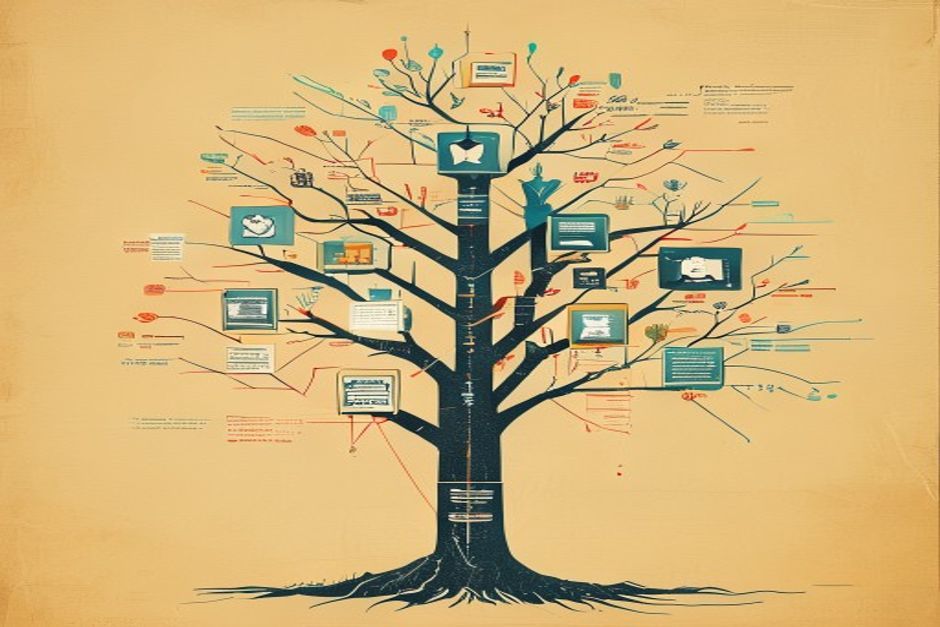
The short version: A multi-agent run is a tree — supervisor → worker → tool → MCP server — but your logs are a flat list. Debugging gets easy the moment you put the whole run on one distributed trace: a single root span, the trace context propagated across every handoff, and one child span per agent turn, tool call, and MCP call, tagged with the OpenTelemetry GenAI semantic conventions. Then you read the run on a timeline instead of grepping stdout.
Why logs fail you here#
When one agent calls another, three things break your usual debugging:
- Causality is lost.
print/loglines from the supervisor and the worker interleave in time order, not call order. You can't tell which line caused which. - The symptom is far from the cause. A wrong final answer three hops up almost always started with a bad tool result deep in the tree.
- The expensive failures are invisible. A retry storm or a token blowup doesn't announce itself in a log line — it shows up on the invoice.
A trace fixes all three because it preserves the shape of the run.
Step 1 — One root span for the whole run#
Open a single span when the workflow starts and make everything a child of it. In Python with OpenTelemetry:
from opentelemetry import trace

tracer = trace.get_tracer("agents")

def run_workflow(goal: str):
    with tracer.start_as_current_span("workflow.run") as root:
        root.set_attribute("workflow.goal", goal)
        return supervisor(goal)
Everything the supervisor and its workers do now hangs off workflow.run, so the entire run shares one trace ID.
Step 2 — Propagate context across every handoff#
This is the step people miss — and it's why hops show up as orphan traces you can't correlate. When an agent hands off to another agent (especially across an async boundary, a queue, or an HTTP call), you must carry the trace context with it.
In-process, start_as_current_span propagates automatically. Across a boundary, inject and extract it:
from opentelemetry.propagate import inject, extract

# supervisor side: attach context to the outbound message
carrier = {}
inject(carrier)
enqueue({"task": task, "trace": carrier})

# worker side: restore it before opening the child span
ctx = extract(message["trace"])
with tracer.start_as_current_span("agent.worker", context=ctx) as span:
    ...
Miss this and the worker's spans land on a different trace — the broken-handoff failure mode, and the single most common reason a multi-agent trace looks incomplete.
Step 3 — Model each turn with the GenAI conventions#
Give every agent turn, tool call, and MCP call its own span, and tag model spans with the OpenTelemetry GenAI semantic conventions so a backend can compute tokens and latency per hop:
with tracer.start_as_current_span("agent.turn") as span:
    span.set_attribute("gen_ai.system", "anthropic")
    span.set_attribute("gen_ai.request.model", "claude-opus")
    resp = model.call(messages)
    span.set_attribute("gen_ai.usage.input_tokens", resp.usage.input_tokens)
    span.set_attribute("gen_ai.usage.output_tokens", resp.usage.output_tokens)

    with tracer.start_as_current_span("tool.search") as tool_span:
        tool_span.set_attribute("gen_ai.tool.name", "search")
        result = run_tool("search", args)
        tool_span.set_attribute("tool.status", result.status)
Add a depth attribute (span.set_attribute("agent.depth", depth)) on each hop. It's the cheapest guard against a retry storm you'll ever write.
Step 4 — Read it on a timeline#
Now the four failure modes that hid in your logs are obvious at a glance:
- Broken handoff → a hop is an orphan trace. Fix Step 2.
- Silent tool timeout → a tool span with
status=errorand a suspiciously long duration. - Retry storm → the same
agent → agentspan repeating in a tight band. Alert whenagent.depthexceeds your budget. - Token / latency blowup → the fat span deep in the tree, with tokens attributed to the exact hop.
Any OpenTelemetry backend will store the trace. A purpose-built view saves you the query-building: Honeycomb's Agent Timeline renders a whole multi-agent, multi-trace run as one screen, and it reads these same GenAI spans — so the instrumentation you just wrote is exactly what it wants.
The rule of thumb#
One run, one trace. Every hop a span. Propagate context or debug blind.
That discipline — not any specific vendor — is what turns "the agents did something and it broke" into a screen you can point at. For the layer this doesn't cover — whether the final answer was actually good — pair it with an eval harness (the eval-framework decision is here).