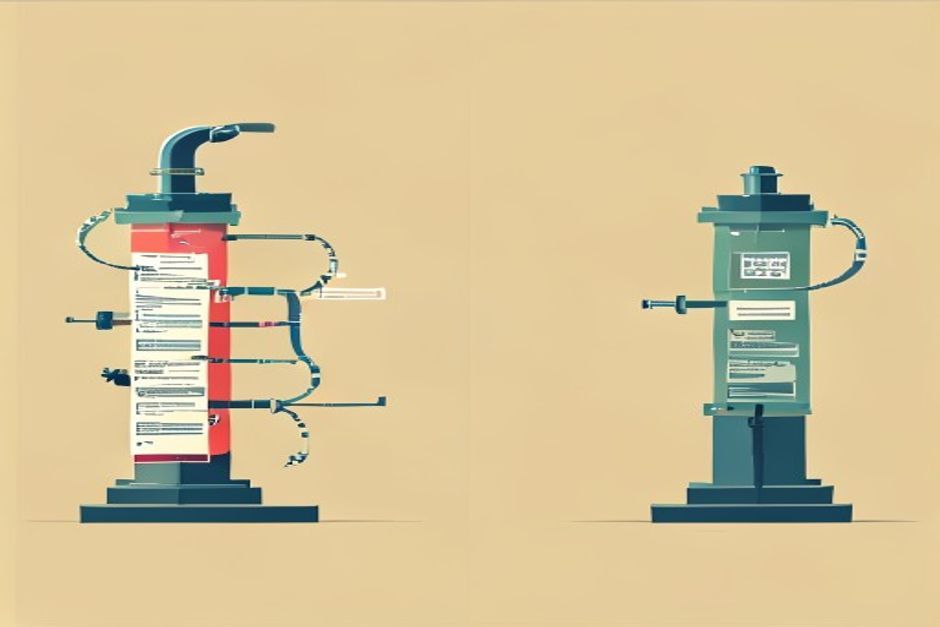

The one-line version: if you instrument an AI agent and keep every trace, your observability bill scales linearly with agent volume — because most vendors bill per span, and one agent run is dozens of them. The instinct is to sample. But the default sampler, head-based TraceIdRatioBased, decides keep-or-drop at the very first span — before the agent has run — so a 10% rate throws away 90% of your errors along with 90% of your successes. That is the exact opposite of what you want. The fix is tail-based sampling: let the whole trace finish, then keep every failure and slow run and thin only the boring ones.
This is the cost-control companion to our how-to on sending agent traces to Honeycomb with plain OpenTelemetry and the Langfuse tool highlight. Instrument first; this is how you keep the bill sane afterward.
Why one agent = a stack of billable units#
A single request to a chat model is one span. A single agent request is not. It's an invoke_agent span wrapping a reasoning loop: a chat span per model call, an execute_tool span per tool, an MCP round-trip or two, maybe a retrieval. Ten turns is easily thirty spans. On Langfuse's billing model, every trace, span, and score is one unit — the free Hobby tier is 50k units a month, and overage runs $8 per 100k. A modestly busy agent clears 50k in days. Honeycomb's free tier is generous at 20M events/month, but the shape is identical: volume is spans, and agents make a lot of spans.
So you sample. The only question is when you decide.
Head sampling saves money on the wrong traces#
The OpenTelemetry SDK's default is a head-based sampler. ParentBased(TraceIdRatioBased(0.1)) hashes the trace ID and keeps 10%. It's free and stateless — a coin flip at the root span. And it's structurally wrong for agents, because it flips that coin before the agent runs. It cannot know the trace is about to fail, so it drops failures at the same 10% rate as everything else. Failures are the rare, expensive events you turned on tracing to catch. Keeping one in ten of them is not a strategy.
Tail sampling decides after it knows what happened#
Move the decision downstream. The tail_sampling processor in the OpenTelemetry Collector buffers the spans of each trace until it completes, then runs a list of policies. Because it sees the finished trace, it can keep on outcome:
processors:
  tail_sampling:
    decision_wait: 10s
    num_traces: 50000
    expected_new_traces_per_sec: 200
    policies:
      # 1. keep every failed agent run
      - name: keep-errors
        type: status_code
        status_code: { status_codes: [ERROR] }
      # 2. keep every slow run (>15s end to end)
      - name: keep-slow
        type: latency
        latency: { threshold_ms: 15000 }
      # 3. sample the boring, successful, fast rest at 10%
      - name: sample-the-rest
        type: probabilistic
        probabilistic: { sampling_percentage: 10 }
The processor keeps a trace if any policy votes to sample it — so the three policies read as "all errors, plus all slow runs, plus 10% of everything else." You can get sharper with an ottl_condition policy (keep traces where gen_ai.usage.input_tokens crossed a ceiling, say — the expensive runs) or an and policy that requires several conditions at once. The point stands: the keep rate for failures is 100%, and the keep rate for noise is whatever you can afford.
The bill you trade for: state#
Tail sampling isn't free the way head sampling is. The processor is stateful — it holds every in-flight trace in memory until it decides. Size it with decision_wait (how long to wait for late spans), num_traces (the buffer ceiling), and expected_new_traces_per_sec; undersize it and the collector silently drops spans or runs out of memory. Set decision_wait longer than your slowest agent run, or you'll cut a 40-turn trace off mid-flight.
The second gotcha bites teams that scale the collector horizontally: you cannot put several tail_sampling collectors behind a round-robin load balancer. Each replica would see only some spans of a trace and make a decision on partial data. Route by trace ID first — put a loadbalancing exporter in front of the sampling tier so all spans of a trace land on the same instance. It's one more hop, and it's the difference between correct sampling and confident garbage.
Get it wired and the economics invert: instead of paying for every clean run that told you nothing, you pay for the fraction you'd actually open — and you never again lose the one trace that explained the outage.