Your agent works. You just can't see it work — which LLM call was slow, which tool errored, where the second agent handed off. The reflex is to reach for a vendor's tracing SDK. Don't. Honeycomb reads plain OpenTelemetry, so you can go from an uninstrumented agent to a live multi-agent timeline using nothing but the standard opentelemetry-sdk, an OTLP exporter, and one auth header — and the exact same instrumentation will later export to Langfuse or Phoenix by changing a URL.
The one-line version: When Honeycomb launched Agent Observability on May 12, 2026, it didn't ship an agent SDK. It integrated the OpenTelemetry GenAI semantic conventions (v1.40.0) directly into the platform. So the gen_ai.* spans that build its Agent Timeline are just OTLP over HTTPS — no proprietary SDK, and therefore no lock-in. As cofounder and CEO Christine Yen put it, most observability tools "weren't built for this sort of 'unknown unknown.'"
This is the how-to companion to our Honeycomb vs Langfuse decision piece and the tool highlight on Honeycomb's OTel-native agent observability. Here we just wire it up. Python throughout.
1. Install and point the SDK at Honeycomb#
Two packages: the SDK and the OTLP/HTTP exporter. No Honeycomb library.
pip install opentelemetry-sdk opentelemetry-exporter-otlp-proto-httpGrab a Honeycomb ingest key (free tier, no card) and export it, then set the tracer up once at process start. The Honeycomb docs give the endpoint (https://api.honeycomb.io, US) and the auth header (x-honeycomb-team). The HTTP exporter wants the full /v1/traces path:
# otel_setup.py
import os
from opentelemetry import trace
from opentelemetry.sdk.resources import Resource
from opentelemetry.sdk.trace import TracerProvider
from opentelemetry.sdk.trace.export import BatchSpanProcessor
from opentelemetry.exporter.otlp.proto.http.trace_exporter import OTLPSpanExporter


def init_tracing(service_name: str = "my-agent") -> None:
    exporter = OTLPSpanExporter(
        # EU region: https://api.eu1.honeycomb.io/v1/traces
        endpoint="https://api.honeycomb.io/v1/traces",
        headers={"x-honeycomb-team": os.environ["HONEYCOMB_API_KEY"]},
    )
    provider = TracerProvider(
        resource=Resource.create({"service.name": service_name})
    )
    provider.add_span_processor(BatchSpanProcessor(exporter))
    trace.set_tracer_provider(provider)
Prefer configuration over code? The same thing in env vars, no exporter arguments needed:
export HONEYCOMB_API_KEY="your-key"
export OTEL_SERVICE_NAME="my-agent"
export OTEL_EXPORTER_OTLP_PROTOCOL="http/protobuf"
export OTEL_EXPORTER_OTLP_ENDPOINT="https://api.honeycomb.io"
export OTEL_EXPORTER_OTLP_HEADERS="x-honeycomb-team=${HONEYCOMB_API_KEY}"
That's the entire Honeycomb-specific surface: one endpoint, one header. Everything below is vanilla OpenTelemetry.
2. Wrap an LLM call in a GenAI span#
The GenAI span conventions say an inference span's name should be {gen_ai.operation.name} {gen_ai.request.model}, its kind CLIENT, and it should carry the operation, provider, model, and token usage. Here's a thin wrapper around an Anthropic call — the attribute names are what matter, not the client:
from opentelemetry import trace
from opentelemetry.trace import SpanKind

tracer = trace.get_tracer("my-agent")


def chat(client, model: str, messages: list) -> object:
    with tracer.start_as_current_span(f"chat {model}", kind=SpanKind.CLIENT) as span:
        span.set_attribute("gen_ai.operation.name", "chat")
        # gen_ai.provider.name was named gen_ai.system in older semconv
        span.set_attribute("gen_ai.provider.name", "anthropic")
        span.set_attribute("gen_ai.request.model", model)

        response = client.messages.create(
            model=model, messages=messages, max_tokens=1024
        )

        span.set_attribute("gen_ai.response.model", response.model)
        span.set_attribute("gen_ai.usage.input_tokens", response.usage.input_tokens)
        span.set_attribute("gen_ai.usage.output_tokens", response.usage.output_tokens)
        return response
Those five gen_ai.* attributes are enough for Honeycomb to recognize the span as an LLM call, chart token usage, and slot it into the timeline. Swapping in OpenAI means changing gen_ai.provider.name to openai and reading tokens off response.usage.prompt_tokens / completion_tokens — the span shape is identical.
3. Emit a tool-call span#
Tool execution is its own span type. The convention: name it execute_tool {gen_ai.tool.name}, kind INTERNAL, with gen_ai.operation.name = execute_tool and the tool's name and call id. Wrap your dispatch:
import json


def execute_tool(name, description, tool_fn, arguments: dict, call_id: str):
    with tracer.start_as_current_span(f"execute_tool {name}", kind=SpanKind.INTERNAL) as span:
        span.set_attribute("gen_ai.operation.name", "execute_tool")
        span.set_attribute("gen_ai.tool.name", name)
        span.set_attribute("gen_ai.tool.type", "function")
        span.set_attribute("gen_ai.tool.description", description)
        span.set_attribute("gen_ai.tool.call.id", call_id)

        result = tool_fn(**arguments)

        # content attributes are opt-in — they can contain user data
        span.set_attribute("gen_ai.tool.call.result", json.dumps(result))
        return result
Because start_as_current_span nests inside whatever span is active, a tool call made during a chat — or during an agent — becomes a child automatically. You get the parent/child structure for free from ordinary Python call order.
4. Run a multi-agent example and open the Agent Timeline#
Give each agent a top-level invoke_agent span and let its LLM and tool spans nest underneath. Run two agents where one hands work to the other:
def run_agent(agent_name: str, task: str, conversation_id: str):
    with tracer.start_as_current_span(f"invoke_agent {agent_name}", kind=SpanKind.INTERNAL) as span:
        span.set_attribute("gen_ai.operation.name", "invoke_agent")
        span.set_attribute("gen_ai.agent.name", agent_name)
        span.set_attribute("gen_ai.conversation.id", conversation_id)
        # inside here, call chat(...) and execute_tool(...) as usual;
        # they nest under this agent span automatically.
        ...


if __name__ == "__main__":
    from otel_setup import init_tracing
    init_tracing("my-agent")

    run_agent("researcher", "find three sources", conversation_id="conv-42")
    run_agent("writer", "draft from the sources", conversation_id="conv-42")

    # flush before the process exits so nothing is lost
    trace.get_tracer_provider().shutdown()
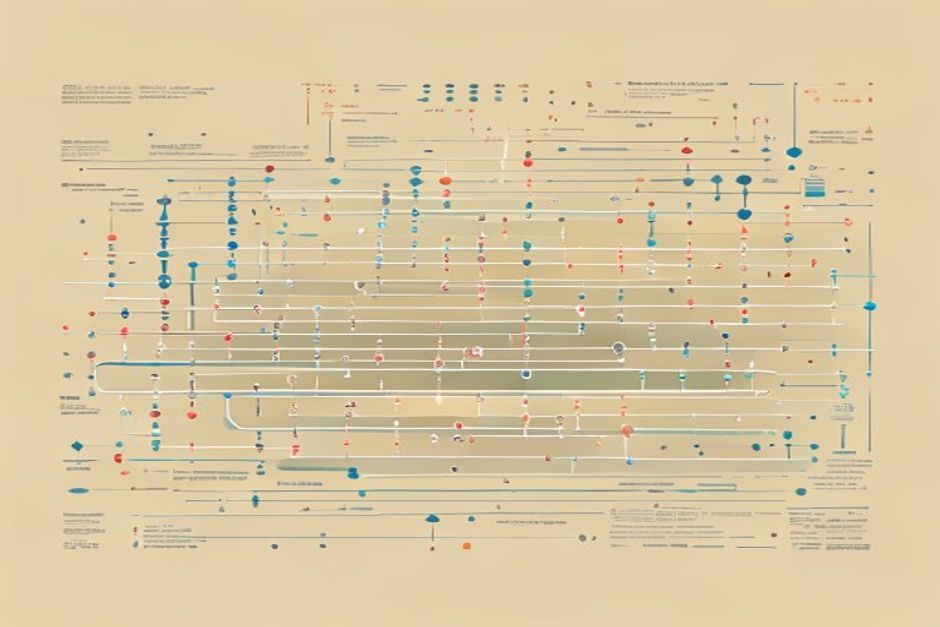
Run it, then open Honeycomb. The Agent Timeline renders the multi-agent, multi-trace run as a single horizontal view — every LLM call, tool invocation, agent handoff, and downstream call laid out in order, correlated by the shared gen_ai.conversation.id. Nothing here was Honeycomb-specific except the endpoint in step 1.
Instrument once, switch backends#
Here's the payoff, and it's not hypothetical. Every attribute above comes from the OpenTelemetry GenAI semantic conventions — a shared standard, not a Honeycomb dialect. Langfuse, Laminar, and Arize Phoenix all expose OTLP endpoints that read the same conventions. So switching backends is a config change, not a rewrite:
# From Honeycomb...
export OTEL_EXPORTER_OTLP_ENDPOINT="https://api.honeycomb.io"
export OTEL_EXPORTER_OTLP_HEADERS="x-honeycomb-team=${HONEYCOMB_API_KEY}"

# ...to Langfuse — same spans, new endpoint + auth header, zero code changes
export OTEL_EXPORTER_OTLP_ENDPOINT="https://cloud.langfuse.com/api/public/otel"
export OTEL_EXPORTER_OTLP_HEADERS="Authorization=Basic ${LANGFUSE_B64_KEYS}"
Your chat, execute_tool, and invoke_agent spans don't change a character. You can even fan out to two backends at once by adding a second BatchSpanProcessor. That's the whole argument for plain OTel over a vendor SDK: the instrumentation is an asset you own, not a dependency you rent. Point it at Honeycomb today for the Agent Timeline; point it somewhere else next quarter if the calculus changes. You wrote it once.